PENETRATION TESTING NOTES (NMAP & METASPLOIT — EDUCATIONAL)
Title: ACK — Penetration Testing Notes: Nmap & msfconsole (for labs and defensive research)
Intro:
During my “security tools” era (2014–2016) I spent time learning the two tools everyone talks about: Nmap (the swiss army knife for network discovery) and Metasploit’s msfconsole (the all-in-one framework console). Below are my personal notes and safe, educational examples — intended for labs, red-team practice in authorized scopes, and blue-team learning. Don’t run intrusive scans or exploits against systems you don’t own or have explicit permission to test.
NMAP — quick reference (high level)
Usage synopsis:
nmap [Scan Type(s)] [Options] {target specification}
Target selection:
-
hostnames, IPs, CIDR, ranges, files (-iL), random (-iR), excludes (--exclude)
Host discovery:
-
-sL (list), -sn (ping only), -Pn (treat all hosts as up), -PS/PA/PU (TCP/UDP probes), -PE/PP/PM (ICMP types)
Scan techniques:
-
-sS (SYN), -sT (connect), -sU (UDP), -sN/-sF/-sX (Null/FIN/Xmas), -sI (idle/zombie), -sO (IP protocol)
Port selection and order:
-
-p <ports> (explicit), -F (fast common ports), --top-ports N, --port-ratio
Service/version detection:
-
-sV (service/version), --version-intensity
Scripting (NSE):
-
-sC (default scripts) or --script=<scripts>, --script-args
OS detection:
-
-O, --osscan-limit, --osscan-guess
Timing / performance:
-
-T0..-T5 (timing templates) and many tuning knobs (--min-rate, --max-retries, etc.)
Evasion/spoofing (use with caution & only when authorized):
-
fragment (-f), decoys (-D), spoof source (-S), --ttl, --spoof-mac
Output:
-
-oN/-oX/-oG/-oA to save results in several formats; verbosity (-v), packet trace (--packet-trace)
Quick safe examples (for lab learning):
-
nmap -v -A target.example.com # aggressive scan (OS + version + scripts + traceroute)
-
nmap -sS -p22,80,443 10.0.0.5 # stealthy SYN scan on common ports
-
nmap -sC -sV --script=vuln target # run default and vuln scripts (lab only)
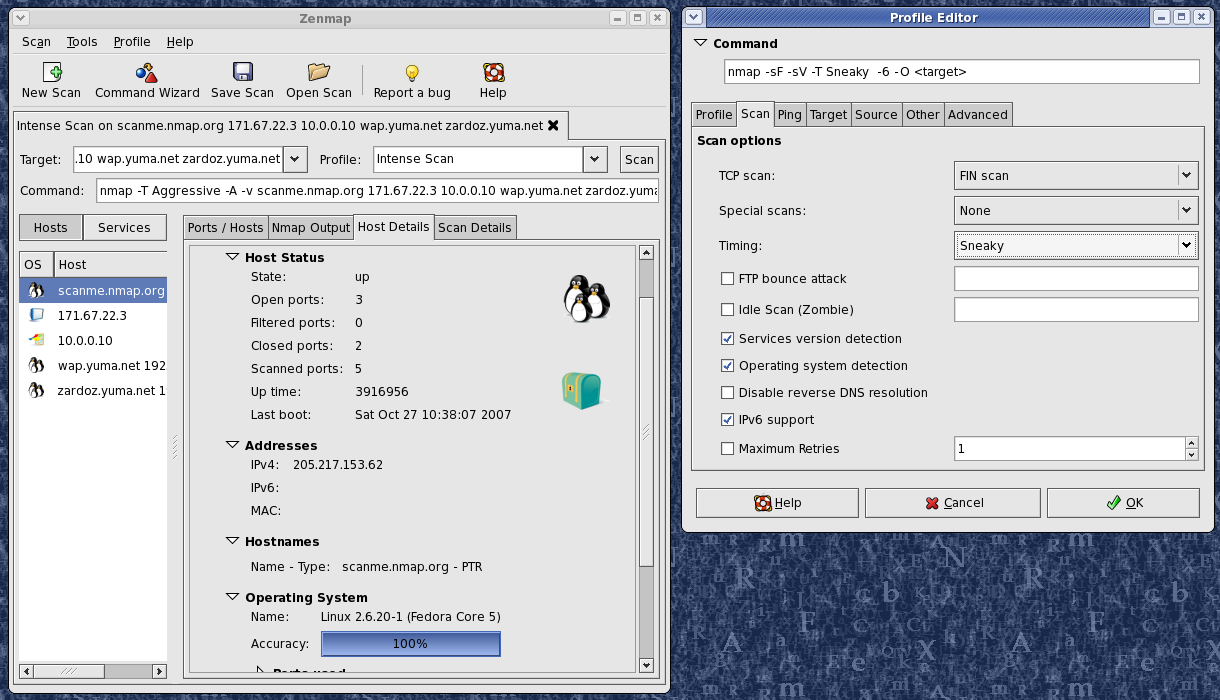
Sample Nmap run (example output summary — informational):
Host is up (0.00005s latency).
All 1000 scanned ports on 192.168.14.135 are closed
Network Distance: 0 hops
(OS guess inconclusive)
METASPLOIT — msfconsole (overview, educational)
What it is:
-
msfconsole is the primary console interface to the Metasploit Framework. It centralizes module search/load/run, job management, scripting (irb), and plugin support.
Launch and help:
-
msfconsole
-
msfconsole -h
-
Inside: help or ? to list commands
Core safe commands (use in lab/with permission):
-
help / ? — list commands
-
banner — show banner
-
search <term> — find modules
-
info <module> — read details (authors, targets, options) about a module
-
show options — list configurable options for a loaded module
-
jobs / kill — list/stop background jobs
-
resource <file> — run a script of console commands (automation)
-
irb — drop into ruby interpreter for framework introspection
-
exit / quit — leave console
Ethical note:
-
Metasploit is a legitimate research and testing framework. Use it only in labs or on systems for which you have explicit authorization. When documenting modules or test results, emphasize defensive context (how to detect/mitigate) and responsible disclosure.
Extra:
-
msfconsole supports tab completion, workspace management, and saving state (makerc, resource files).
-
Many organizations use Metasploit in controlled red-team / purple-team exercises; always follow engagement rules of engagement (ROE).
Closing:
These notes are a compact reminder — Nmap for discovery and passive/active reconnaissance, Metasploit for controlled exploitation research and post-exploitation labs. Both require ethical boundaries: never attack unconsented targets.
Suggested English tags:
nmap, network-scanning, pentest, metasploit, msfconsole, cybersecurity, redteam, blueteam, defensive-security, ethical-hacking, kali, reconnaissance
ESPAÑOL — ACK: NOTAS SOBRE PENETRACIÓN (NMAP Y METASPLOIT — EDUCATIVO)
Título: ACK — Notas de Penetration Testing: Nmap y msfconsole (para laboratorio y estudio defensor)
Introducción:
En mi etapa de herramientas de seguridad (2014–2016) me hice amigo de dos clásicos: Nmap (navaja suiza para descubrimiento) y msfconsole de Metasploit (consola todo-en-uno). Abajo tienes notas y ejemplos en un contexto puramente educativo/defensivo. No ataques sistemas sin permiso.
NMAP — referencia rápida (nivel alto)
Resumen de uso:
nmap [TipoEscaneo] [Opciones] {objetivo}
Selección de objetivos:
-
hostnames, IPs, CIDR, rangos; -iL (lista), -iR (aleatorio), --exclude
Descubrimiento:
-
-sL (listar), -sn (ping), -Pn (tratar como online), -PS/PA/PU (probes TCP/UDP), -PE/PP/PM (ICMP)
Técnicas de escaneo:
-
-sS (SYN), -sT (connect), -sU (UDP), -sN/-sF/-sX (Null/FIN/Xmas), -sI (idle)
Puertos y orden:
-
-p <puertos>, -F (rápido), --top-ports
Detección de servicio/versión:
-
-sV, --version-intensity
Scripting (NSE):
-
-sC o --script=..., con --script-args si hace falta
Detección de OS:
-
-O
Timing:
-
-T0..-T5 y parámetros finos (--min-rate, --max-retries)
Evasión (solo autorizado):
-
fragmentación (-f), decoys (-D), spoofing (-S), --spoof-mac
Salida:
-
-oN/-oX/-oG/-oA, -v, --packet-trace
Ejemplos seguros (laboratorio):
-
nmap -v -A objetivo # escaneo agresivo en lab
-
nmap -sS -p22,80,443 10.0.0.5
Salida de ejemplo (resumen informativo):
Host is up (0.00005s latency).
All 1000 scanned ports on 192.168.14.135 are closed
Network Distance: 0 hops
METASPLOIT — msfconsole (resumen, educativo)
Qué es:
-
msfconsole es la interfaz principal de Metasploit. Centraliza búsqueda, info de módulos, jobs, scripting (irb) y plugins.
Arranque y ayuda:
-
msfconsole
-
msfconsole -h
-
Dentro: help o ?
Comandos centrales (lab / con permiso):
-
help / ? — listado de comandos
-
search <término> — buscar módulos
-
info <módulo> — ver detalles del módulo
-
show options — ver opciones del módulo cargado
-
jobs / kill — gestionar jobs en background
-
resource <archivo>— ejecutar secuencia de comandos
-
irb — consola ruby para explorar internals
-
exit / quit — salir
Ética:
-
Metasploit sirve para investigación y pruebas controladas. Úsalo solo en entornos autorizados. Al documentar, enfoca en detección y mitigación.
Cierre:
Nmap = descubrimiento; Metasploit = investigación/controlado. Ambos poderosos: siempre respetar límites legales y reglas de engagement.
TCP/IP stack fingerprinting

Contents
[hide]TCP/IP Fingerprint Specifics[edit]
- Initial packet size (16 bits)
- Initial TTL (8 bits)
- Window size (16 bits)
- Max segment size (16 bits)
- Window scaling value (8 bits)
- "don't fragment" flag (1 bit)
- "sackOK" flag (1 bit)
- "nop" flag (1 bit)
p0f v3 (version 3.08b)
1. What's this?
- Highly scalable and extremely fast identification of the operating system and software on both endpoints of a vanilla TCP connection - especially in settings where NMap probes are blocked, too slow, unreliable, or would simply set off alarms.
- Measurement of system uptime and network hookup, distance (including topology behind NAT or packet filters), user language preferences, and so on.
- Automated detection of connection sharing / NAT, load balancing, and application-level proxying setups.
- Detection of clients and servers that forge declarative statements such as X-Mailer or User-Agent.
2. What's the output?
3. Can I have it?
- TCP SYN ("who is connecting to me?") signatures for a variety of systems - especially from some of the older, more exotic, or more specialized platforms, such as Windows 9x, NetBSD, IRIX, Playstation, Cisco IOS, etc. To do this, you simply need to attempt establishing a connection to a box running p0f. The connection does not need to succeed.
- TCP SYN+ACK signatures ("who am I connecting to?"). The current database is minimal, so all contributions are welcome. To collect these signatures, you need to compile the supplied p0f-sendsyn tool, and then use it to initiate a connection to an open port on a remote host; see README for more.
- HTTP request signatures - especially for older or more exotic browsers (e.g. MSIE5, mobile devices, gaming consoles), crawlers, command-line tools, and libraries. To collect a signature, you can run p0f on the client system itself, or on the web server it talks to.
- HTTP response signatures. P0f ships with a minimal database here (only Apache 2.x has any real coverage). Signatures are best collected for three separate cases: several minutes of casual browsing with a modern browser; a request with curl; and another one with wget.

P0f
| Developer(s) | Michal Zalewski |
|---|---|
| Stable release | 3.08b / 2014-11-08 |
| Written in | C |
| Operating system | Linux, Macintosh, Windows |
| Type | OS fingerprinting |
| Website | lcamtuf |
Contents
[hide]Features[edit]
- machines that connect to your box (SYN mode)
- machines you connect to (SYN+ACK mode)
- machines you cannot connect to (RST+ mode)
- machines that talk through or near your box
- masquerading and firewall presence (useful for policy enforcement)
- the distance to the remote system and its uptime
- other guys' network hookup (DSL, OC3, avian carriers) and his ISP
Advantage over other fingerprinting tools[edit]
How it works[edit]
Usage[edit]
Usage: p0f [ -f file ] [ -i iface ] [ -L ] [ -r file ] [ -o file ]
       [ -s file ] [ -d ] [ -u user ] [ -p ] [ -S num ] [ -m c,h ] [ -t c,h ]
  -f file  - reads fingerprint database (p0f.fp) from file
  -i iface - listen on specific network interface
  -L       - list all available network interfaces
  -r file  - read pcap packet file instead of listening to an interface
  -o file  - append output to file in grep-friendly format
  -s file  - output to a socket
  -d       - go into daemon mode
  -u user  - switch to specified user and drop privileges, use with -d

  -p       - put the selected interface into promiscuous mode
  -S num   - set maximum number of API client connections, default is 20
  -m c,h   - set maximum number of clients and hosts to be tracked
  -t c,h   - set timeouts for any connection(c) and for purging idle hosts (h)

AMAP
amap - a powerful application mapper
CONTENTS
Synopsis
Description
Modes
Options
License And User Bewares
Bugs
SYNOPSIS
amap [Mode] [Options] <target> <port/portrange> [<port> ...]
DESCRIPTION
Amap is a scanning tool that allows you to identify the applications that are running on a specific port or ports. This is achieved by connecting to the port(s) and sending trigger packets. These trigger packets will typically be an application protocol handshake. Many network daemons will only respond to the correct handshake (i.e. SSL). Amap then looks up the response in a list and prints out any match it finds. Amap supports tcp and udp protocols, regular and SSL-enabled ASCII and binary protocols and a variety of options are at your disposal to control the behaviour of the tool. It can take an nmap machine readable output file as its input file and can log to a file and screen.
Why use our tool? Well, when portscanning a host, you will be presented with a list of open ports. In many cases, the port number tells you what application is running. Port 25 is usually SMTP, port 80 mostly HTTP. However, this is not always the case, and especially when dealing with proprietary protocols running on non-standard ports you will not be able to determine what application is running. With amap, you will be able to identify that SSL server running on port 3445 and some oracle listener on port 23. Also, it will actually do an SSL connect if you want and then try to identify the SSL-enabled protocol!
Please also see amapcrap -h for an additional tool for ports who do not give any output.
MODES
amap can be run in three different modes:
-A Map applications: send triggers and analyse responses (default). All options can be used in this mode. -B Just grab banners, do not send triggers. Only a few commandline options are used from the set when run this mode. They are maked below as "(Banner)" -P No banner, application, stuff - be a (full connect) port scanner! Only a few commandline options are used from the set when run this mode. They are maked below as "(Portscan)" -W This is the Web Online Update mode. When specifying this option, all other options except -D are ignored, and the application fingerprints and triggers are updated from the thc.org web site.
OPTIONS
Options can also be seen by typing ’amap -h’. Here follows an explanation of all options.
HOSTS AND PORTS (all modes)
-i <file>This makes amap read its hosts and ports from the specified file. The file must be
Generated by nmap, using the -oM <file> option of nmap. It doesn’t matter if you have multiple hosts and mixed tcp and udp ports in the file: amap reads them all.lt;target> and <port/portlist> Target can be an IP address or fully qualified host name. A port can be any number between 1 and 65535, ranges (e.g. 1-65535) are also supported. You can specify as many ports on the command line as you want. Ports are by default TCP (see -u option below). GENERAL OPTIONS
None of these are required but some can be quite useful.
Note that all options can be used in amap’s default mode (-A), the banner grab (-B) and portscan modes (-) support only those options which are marked as such.
-uPorts specified on commandline are UDP (default is TCP). (Modes: Amap, Banner, Portscan) -6 Use IPv6, not IPv4 -1 Only send triggers to a port until 1st identification. Speeeeed! -v Verbose. Usually not used, but gives detailed info on the screen as to what connections are made to what ip’s/ports. Don’t use twice. You will be bored to death with even more stupid uninteresting information. (Modes: Amap, Banner, Portscan) -q Quiet. Has got nothing to do with the "-v" option :-) If the -q option is applied, all closed and timed out ports are NOT marked as unidentified, and are not reported at all. -d Make a hex dump of all received responses. The default is to only print unrecognised responses. -U Do not dump unrecognized responses. (see option above) -b Print ACSII banners (if one is received). -o <file> Log the output of amap to <file>. (Modes: Amap, Banner, Portscan) -m <file> Make the log file output (-o option) machine readable (colon seperated). (Modes: Amap, Banner, Portscan) -D <file> Triggers and responses are read by default from appdefs.trig and appdefs.resp. By specifying for instance ’-D trojans’ it will read triggers and responses from trojans.trig and trojans.resp. It can be very usefull if you only want to scan for certain applications. Please take a look at the appdefs files to see what the format of these files is (it’s pretty simple, you shouldn’t have any trouble adding your own triggers and responses, which you are encouraged to do, btw). SCANNING OPTIONS These options influence the behaviour of amap when scanning. -p <proto> This specifies a single protocol trigger to send. The name of the protocol must match one of the first fields of the lines in the trigger file. For instance, ’-p SSL’ will scan only for SSL enabled port. However, if by chance other protocols are also indentified, they will be printed. -S Do NOT NOT look behind an SSL port. Otherwise amap will reconnect later to identify the service running behind the ssl wrapper. -R Do NOT identify RPC service. Otherwise amap will connect many times to identify the exact rpc service type and version. This can be time consuming. -c n Open ’n’ parallel tasks (connections). The default is 32, the maximum 256. (Modes: Amap, Banner, Portscan) -C n If a TCP connect timed out (did not finnish in "-T n" time), how often should be retried the connect? This is by default 3. (Modes: Amap, Banner, Portscan) -T n Causes amap to wait upto ’n’ seconds for a successful TCP connect. Default is 5 seconds, but this can be too few sometimes when scanning over a slow link, and too long on a LAN. (Modes: Amap, Banner, Portscan) -t n Causes amap to wait upto ’n’ seconds for a response. Default is 5 seconds, but this can be too few sometimes when scanning over a slow link, and too long on a LAN. (Modes: Amap, Banner) -H Skip potentially harmful triggers. Some daemons and applications will crash when receiving long or unexpected binary input. -H skips triggers marked as potentially harmful. See appdefs.trig for information on how to mark a trigger as harmful.
LICENSE AND USER BEWARES
amap is (C) 2003 by vanHauser and DJ.RevMoon (of THC - www.thc.org)This program is free software; you can redistribute it and/or modify it under the terms of the GNU General Public License as published by the Free Software Foundation; Version 2. This guarantees your right to use, modify, and redistribute amap under certain conditions.
Source is provided to this software because we believe users have a right to know exactly what a program is going to do before they run it. This also allows you to audit the software for security holes.
Source code also allows you to port amap to new platforms, fix bugs, and add new features. You are highly encouraged to send your application triggers and responses to us. Please send triggers and responses (either as a tcpdump file or in our own format) to amap-dev@thc.org.
This program is distributed in the hope that it will be useful, but WITHOUT ANY WARRANTY; without even the implied warranty of MERCHANTABILITY or FITNESS FOR A PARTICULAR PURPOSE. See the GNU General Public License for more details (it is in the COPYING file of theamap distribution).
It should also be noted that amap has been known to crash certain poorly written applications, TCP/IP stacks, and even operating systems. Amap should never be run against mission critical systems unless you are prepared to suffer downtime. We acknowledge here that Amap may crash your systems or networks and we disclaim all liability for any damage or problems Amap could cause.
BUGS
There are bound to be numerous bugs in amap. Please tell us if you find any. Please email to amap-dev@thc.org.
Top of page |


